Figure 3.

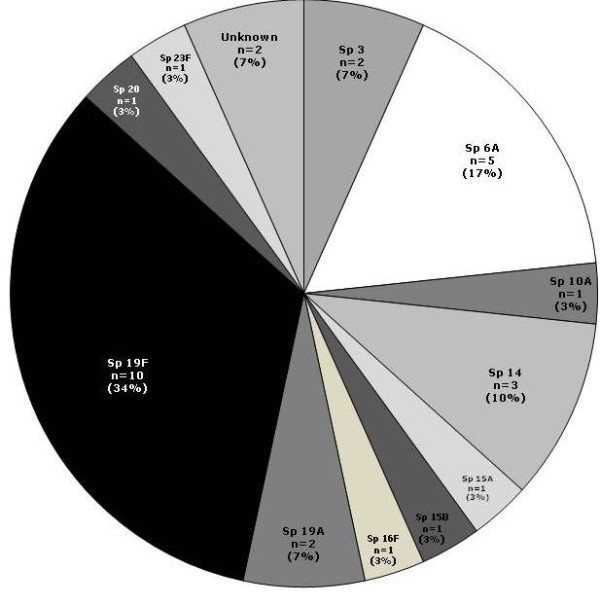
Serotype distribution of S. pneumoniae (N = 30) positive isolates cultured from middle ear fluid samples. The pie chart shows each serotypes of S. pneumoniae with their respective percentage of positive episodes.

Serotype distribution of S. pneumoniae (N = 30) positive isolates cultured from middle ear fluid samples. The pie chart shows each serotypes of S. pneumoniae with their respective percentage of positive episodes.