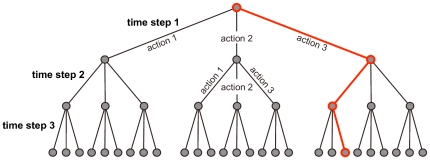
Figure 1. Simple Policy Tree. Suppose there are three possible actions and, in each time step, we can only choose one of them.
Each level in the tree corresponds to a time step and branches represent possible actions. The red path through the tree represents the following three-step time-based intervention: First choose action 3, then action 1, and finally action 3 again. The policy tree for antiviral distribution has a similar organization. The UCT algorithm iteratively selects paths through the tree that represent intervention policies to be simulated.

