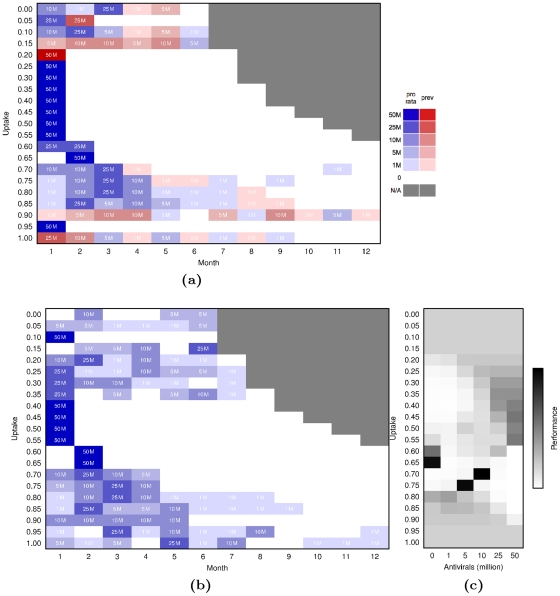
Figure 5. Optimized Policies for Pandemic Influenza with a Reproduction Number of  .
.
(5a) Optimized policies combining prevalence-based (red) and population-based distributions (blue). Each row gives the optimized sequence of actions for a given value of uptake. (5b) Optimized policies allowing only population-based distributions. (5c) Performance of possible actions for the first distribution for a population-based policy, two months after the pandemic has reached 100,000 cases. Shading indicates number of times an action was visited during the optimization routine, and is thus proportional to the performance of the action.

