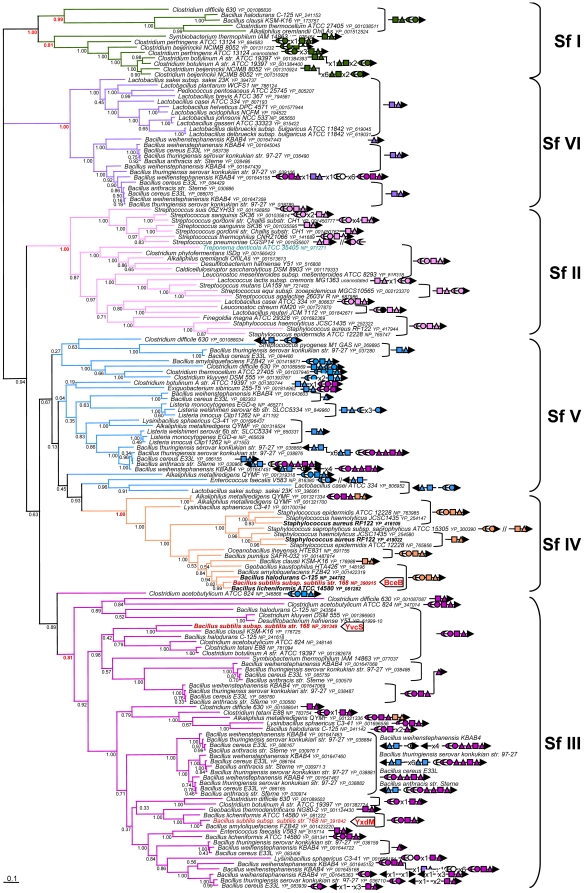
Figure 2. Phylogeny of the BceB-like proteins (MSD components).
Bayesian tree showing the relationships in a subsample of 164 BceB-like sequences. The accession number of each sequence is provided. Numbers at nodes are posterior probabilities. The scale bar indicates the average number of substitutions per site. Based on the phylogeny of each component, six subfamilies (numbered from I to VI) were defined; they are indicated here by brackets and colours. Symbols represent Bce-like components encoded by genes located in the neighbourhood of bceB-like homologs: triangles correspond to MSD, crescents to regulators, circles to kinases, squares to NBD, and numbers indicate the number of non bce-like genes. The arrow indicates the direction of transcription. Color of the symbols indicates to which family they belong and corresponds to the color of the tree branchs (green I; light pink II; dark pink III; orange IV; blue V, purple VI, whereas black is used to designate unclassified homologs and white symbols indicate non homologous regulators, kinases, NBDs or MSDs). BceB, YvcS and YxdM from B. subtilis homologs are indicated in red and by a thick arrow. The unique non Firmicutes BceB-like homologue from T. denticola is shown in light blue. The length of the alignment used to construct the tree was 251 residues. BceB-like proteins used for recombinant strain construction were indicated in bold characters.

