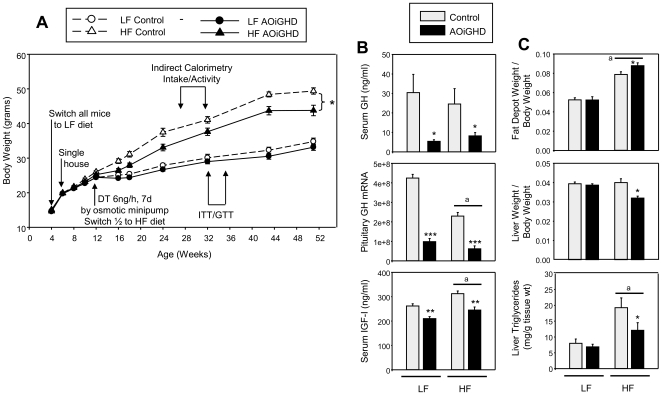
Figure 3. Optimized paradigm to generate AOiGHD mice and compare the impact of a high fat and low fat diet.
(A) Growth curves, (B) Circulating GH and IGF-I levels (from t0 GTT samples, Fig. 3A) and pituitary GH mRNA (copy number/0.05µg total RNA adjusted by a normalization factor of 3 separate housekeeping genes, see methods for details). (C) Fat depot (combined subcutaneous, urogenital and retroperitoneal fat pads) and liver weights adjusted by body weight and liver triglyceride content (mg/g tissue weight). Asterisks indicate values which significantly differ from controls, * p<0.05, ** p<0.01, *** P<0.001. “a” indicates significant impact of diet, independent of GH status (p<0.05). Values are means +/− SEM of n = 12–17 mice/group.

