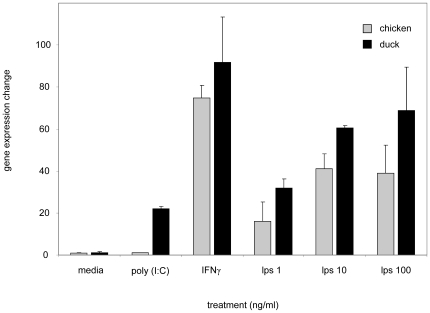
Figure 5. Activated chicken and duck splenocytes measured for iNOS expression levels by QRT-PCR.
Chicken and duck splenocytes were cultured for 20 hours with a range of concentrations of LPS (1, 10, and 100 µg/ml) or a single concentration (10 µg/ml) of poly(I:C) or recombinant chicken IFNγ protein. RNA was collected from the cells and quantified iNOS gene levels determined. Obtained iNOS mRNA values were normalized to GAPDH and expression levels are shown as mean fold expression change relative to un-stimulated controls. Experiments were performed in triplicate and data are representative of 3 independent experiments.

