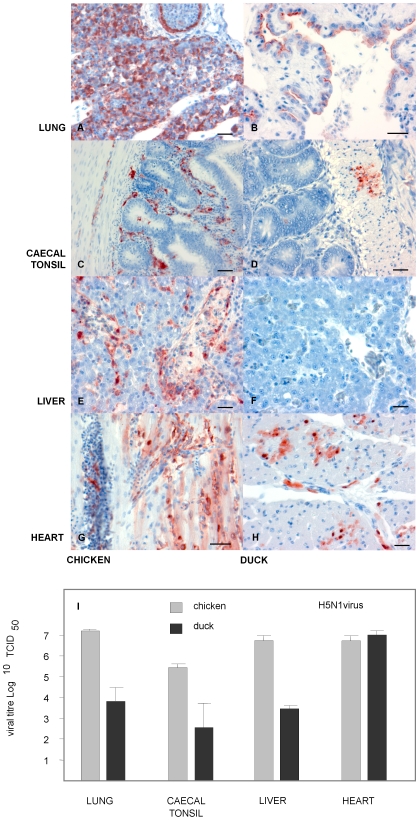
Figure 8. H5N1 infection appears more widespread in chicken tissues in comparison to duck tissues.
IHC for H5N1 antigen, left-hand panel shows staining in chicken tissues, right-hand panel shows staining in duck tissues (A) Chicken lung 24 hours post infection (h.p.i), with IHC stain showing H5N1 viral antigen as red/brown colour. (B) Duck lung 72 h.p.i., H5N1 antigen was less prevalent in duck lung tissue than in chicken. H5N1 antigen was detected in single cells scattered within the lung parenchyma and in the hyaline cartilage. (C) Chicken caecal tonsil 24 h.p.i., with H5N1 in caecal lymphoid follicles and submucosa. (D) Duck caecal tonsil 72 h.p.i., with similar H5N1 antigen staining. (E) Chicken liver tissue 24 h.p.i., with severe H5N1 antigen staining. (F) Duck liver 72 h.p.i., showed no signs of viral antigen. (G) Chicken heart tissue 24 h.p.i. showed H5N1 staining in the myocardium and typically near blood vessels. (H) Duck heart tissue 72 h.p.i., with IHC H5N1 antigen staining the myocardium. All scale bars = 50 µm. (I) The graph shows viral replication efficiency between chickens and ducks across a range of organs following H5N1 Vt453 infection. In chickens 24 h.p.i, lung, caecal tonsil, liver and heart tissue showed between 5.5 and 7 log10 TCID50. Similarly, ducks had 7 log10 TCID50 of virus in heart tissue, but moderately less virus in other tissues, between 2.5 and 4 log10 TCID50.

