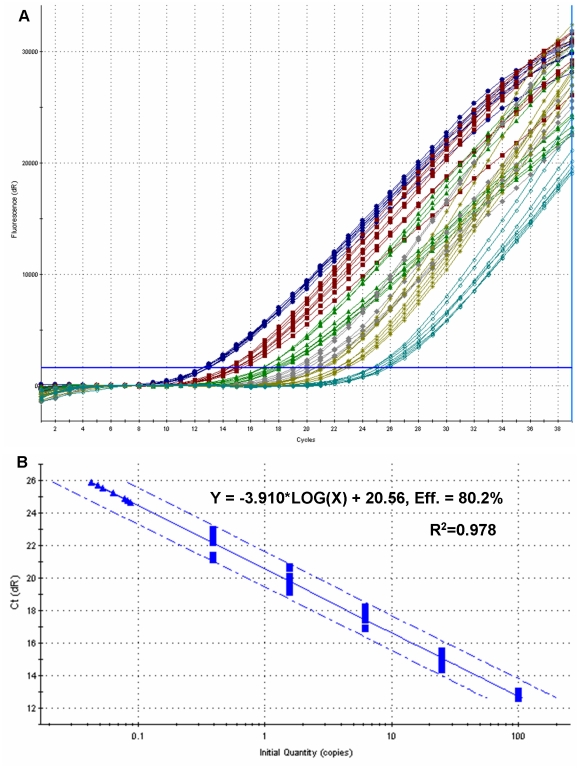
Figure 5. Amplification plots of mutant DNA (V136) detection in plasmid standard pools.
(A) FAM fluorescent signals and (B) corresponding standard curve generated from plasmid standard pools with pre-defined mutant DNA concentrations. From left to right, curves represent 100%, (blue lines with circles), 25% (red lines with squares), 6.25% (green lines with triangles), 1.56% (grey lines with diamonds) and 0.39% (yellow lines with stars), V136 frequencies (the 95% confidence limits for the standard curve are shown as hashed lines). Wild-type (A136) samples are also included in the reaction and are placed in the far right (A) and are denoted by triangles in (B). Reactions were performed with 8 replicates. The threshold cycle (Ct) values (B) are plotted against the logarithm of the mutant DNA frequency (%).

