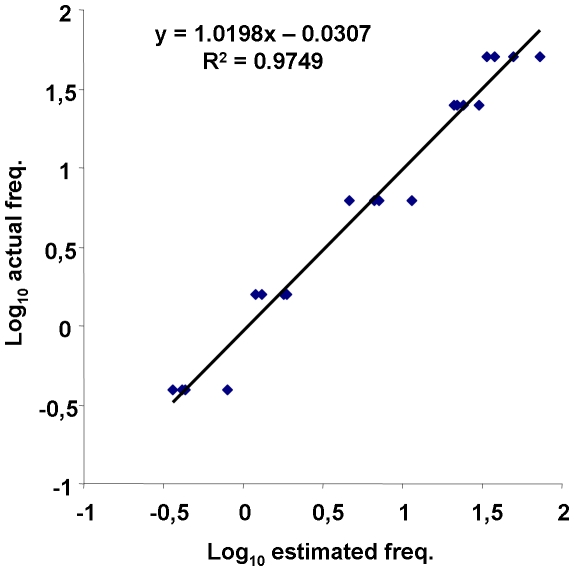
Figure 6. Linear regression of the estimated mutant (V136) log10 frequencies on the actual log10 frequencies.
Four series of genomic DNA pools containing V136 polymorphism at different frequencies (50%, 25%, 6.25%, 1.56%, and 0.39%) were tested by the basic real-time LCR protocol. Each sample was analysed in four replicates.

