Figure 2.
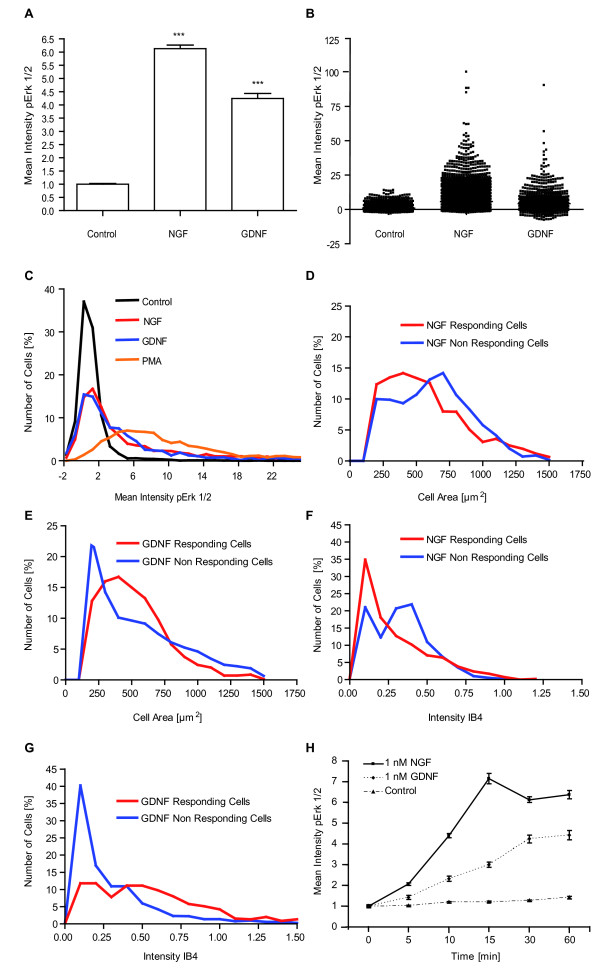
NGF and GDNF stimulation leads to Erk1/2 phosphorylation in subpopulations. A) Stimulation with NGF (1 nM, 30 min) and GDNF (1 nM, 30 min) led to significant increase of pErk1/2 intensity levels (n = 5203 cells for no stimulus, n = 3778 cells for NGF treatment, n = 1275 cells for GDNF treatment, error bars are SEM, p < 0.001 for NGF/GDNF vs control). B) 1D scatter plot of the single cell data plotted in A) as bar graphs. Thereby, the huge heterogeneity with up to 100-fold intensity differences is clearly visible. C) Intensity histogram of unstimulated (black line), NGF (red line), GDNF (blue line) and PMA (orange line) stimulated DRG-cultures. Stimulation led to increased numbers of cells with higher fluorescent intensities. PMA activates Erk1/2 in virtually all neurons as nearly no cells remain with intensities of the control condition. D), E) Cell size profile of NGF/GDNF responding and non-responding cells. Responding neurons tend to be smaller in size. F), G) IB4 fluorescence intensity profile of NGF/GDNF responding and non-responding cells. NGF responding neurons tend to low intensity IB4 labeling while GDNF responding cells are mostly strongly IB4 labeled. H) Kinetic of NGF/GDNF induced Erk1/2 phosphorylation (n = 1000-4000 cells per time point, error bars SEM).

