Figure 3.

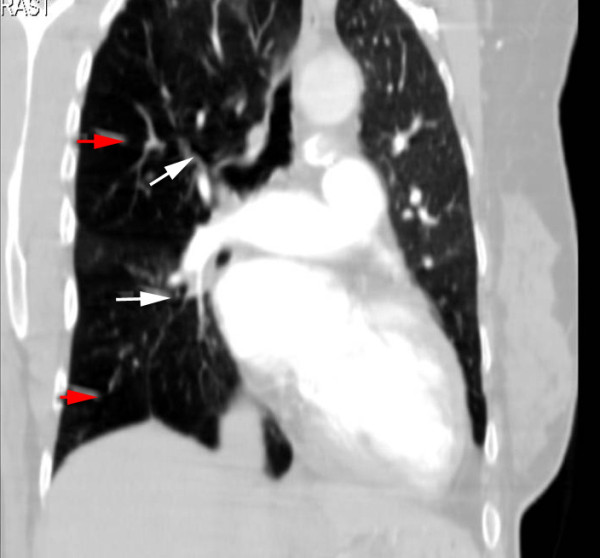
Chest angio-computed tomography revealing hypoplasia/agenesis of the right pulmonary artery (white arrows) and hyperinflation of the pulmonary parenchyma (red arrows).

Chest angio-computed tomography revealing hypoplasia/agenesis of the right pulmonary artery (white arrows) and hyperinflation of the pulmonary parenchyma (red arrows).