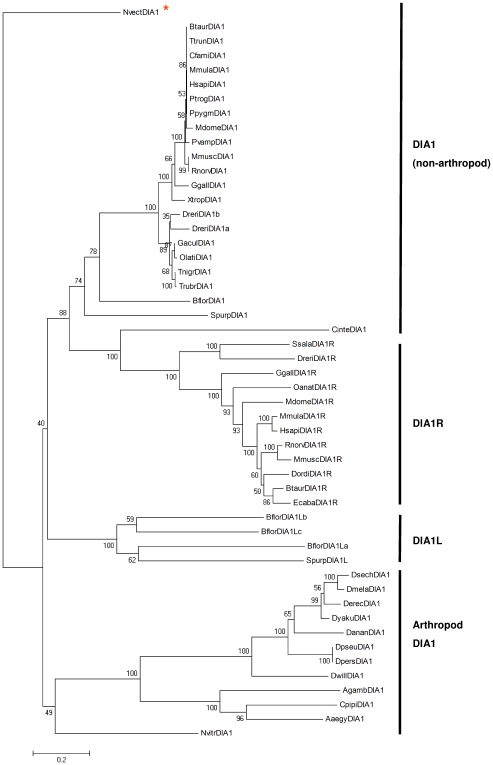
Figure 6. Evolutionary relationships between DIA1-family members.
The evolutionary history of the DIA1 family was inferred using the neighbour-joining method [57]. The optimal tree is shown, with statistical reliability of branching assessed using 1000 bootstrap replicates [155], where percentage values are shown next to the branches. The tree is drawn to scale, with branch lengths in the same units as those of the evolutionary distances used to infer the phylogenetic tree. The evolutionary distances were computed using the Poisson correction method [170] and units are the number of amino acid substitutions per site. All positions containing gaps were eliminated from the dataset (Figure S10). There were a total of 258 positions in the final dataset. Phylogenetic analyses were conducted in MEGA4 [150]. The tree was rooted on the cnidarian N. vectensis DIA1 sequence (NvectDIA1), as highlighted with an asterisk. Organism abbreviations use the first letter of the genus name, followed by the first four letters of the species. Full species names and accession numbers can be found in Tables S1, S4 and S7.

