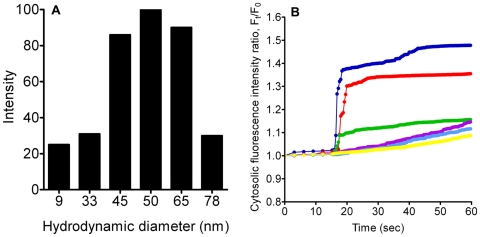
Figure 1. TiO2 NP characterization and resultant [Ca2+]C changes after NP treatment.
A) DLS assessment of TiO2 NPs in Hanks' solution showed a size distribution of ∼9 to 80 nm. B) Cells were treated with TiO2 NPs with concentrations of 0.05 mg/ml (yellow), 0.1 mg/ml (Light Blue), 0.25 mg/ml (Purple), 0.5 mg/ml (Green), 0.75 mg/ml (Red), and 1 mg/ml (Blue) in normal Hanks' solution. Each line represents the average fluorescence intensity of approximately 200 cells per well.

