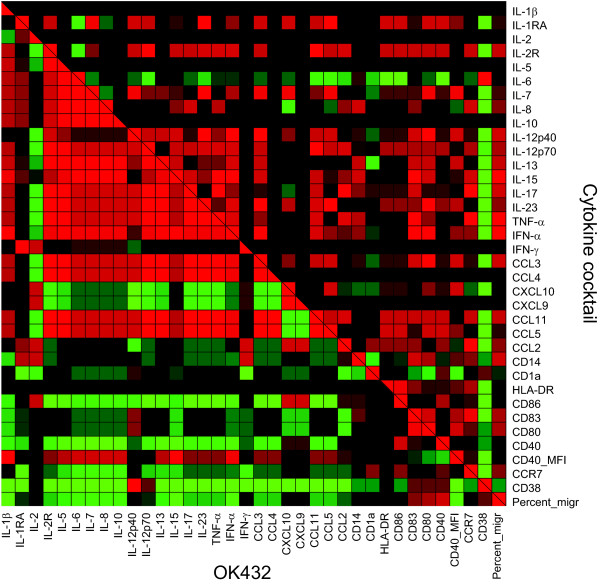
Figure 4.
The effect of OK432 is clearly different from the effect of the cytokine cocktail. To reveal the relationships between the parameters tested and the similarities between DC matured with the cytokine cocktail and OK432 for 24 hours, a bivariate correlation analysis was performed and the Spearman coefficient was plotted in a heat map. The Spearman coefficient is in the interval from -1 (negative correlation, shown in green) to 0 (no correlation or no data, shown in black) to +1 (positive correlation, shown in red). Top right shows the correlation for the cytokine cocktail treated DC and lower left side shows correlation for OK432 treated DC. For the surface markers the percentage of positive cells is displayed, except CD40, which is shown with the MFI. The correlation does not change when including the MFI for the rest of the flow cytometry markers. The migration is displayed with the percentage of migrated DC. Five independent experiments are included.

