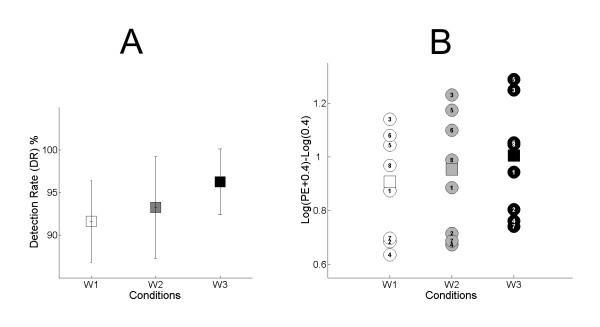
Figure 2.
Behavioral performance. (A): Mean values and standard deviation of Detection Rate (DR) for all 8 subjects for conditions W1, W2 and W3. (B): PE values from each individual subject are represented as circles. Squares represent the mean values of Position Error (PE) in the period T2 for condition W1 (white), W2 (grey) and W3 (black). Note that PE increases linearly from W1 to W2 to W3.

