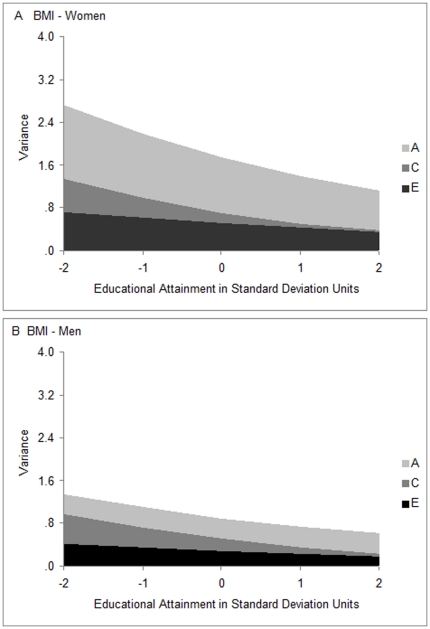
Figure 3. Variance components of BMI as functions of educational attainment.
The x-axes represent educational attainment in standard deviation units. The y-axes represent variance in BMI in standard units. Males and females are shown on the same scale so that variances are comparable, and birth year effects have been removed. Variance components attributable to genetic influences (labeled A as is common) are shown in light gray. Variance components attributable to shared environmental influences (labeled C), familial and local community influences that make members of twin pairs similar, are shown in dark gray. Variance components attributable to nonshared environmental influences(labeled E) that produce differences in BMI in members of twin pairs, are shown in black.

