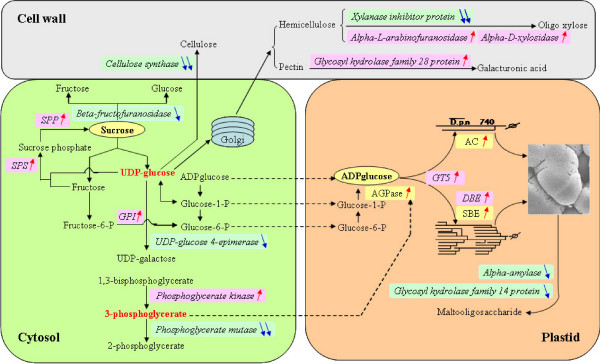
Figure 4.
Overlays of differentially expressed genes onto starch and non-starch polysaccharide metabolism pathways. Up arrows designate up-regulation of the genes and down arrows down-regulated genes. The number of arrows indicates the number of genes. AC, amylose content; AGPase, ADP-glucose pyrophosphorylase; DBE, starch debranching enzyme; GPI, glucose-6-phosphate isomerase; GT5, glycosyltransferase family 5 protein; SBE, starch branching enzyme; SPP, sucrose phosphatase; SPS, sucrose phosphate synthase.

