Figure 1.
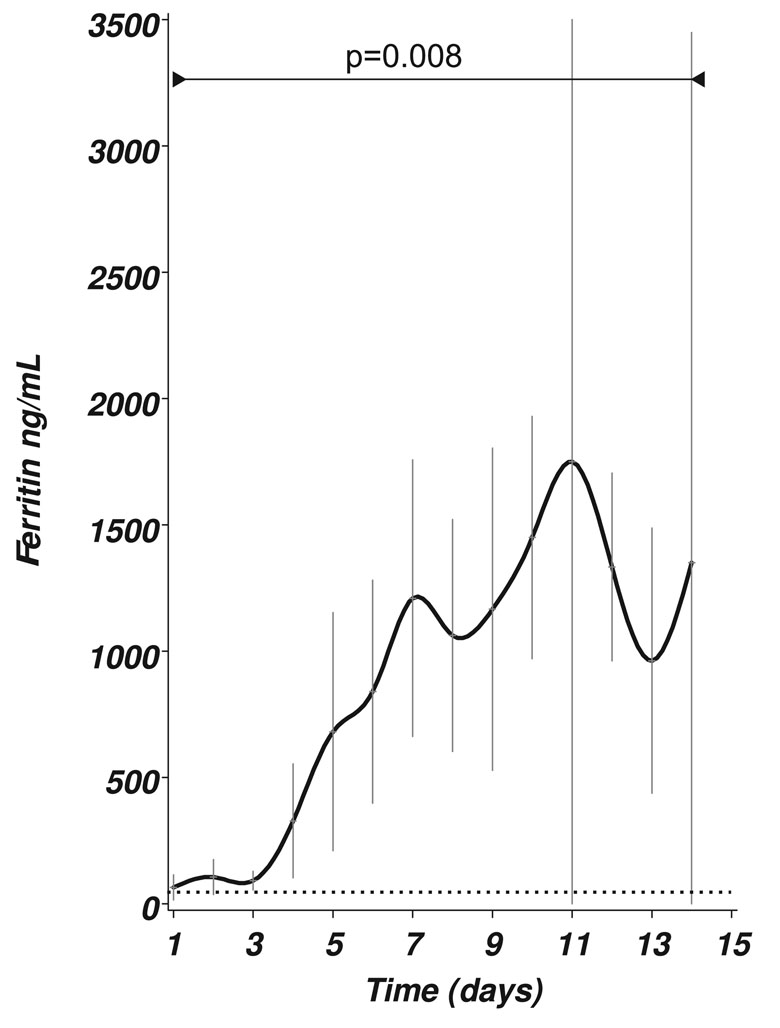
Figure 1: (A) CSF ferritin levels [ng/mL] in SAH patients over a 14 day period. There was a significant change of the mean (±SEM) levels over time (F=2.41, p=0.008). The horizontal dotted line indicates the upper reference limit of 12 ng/mL.
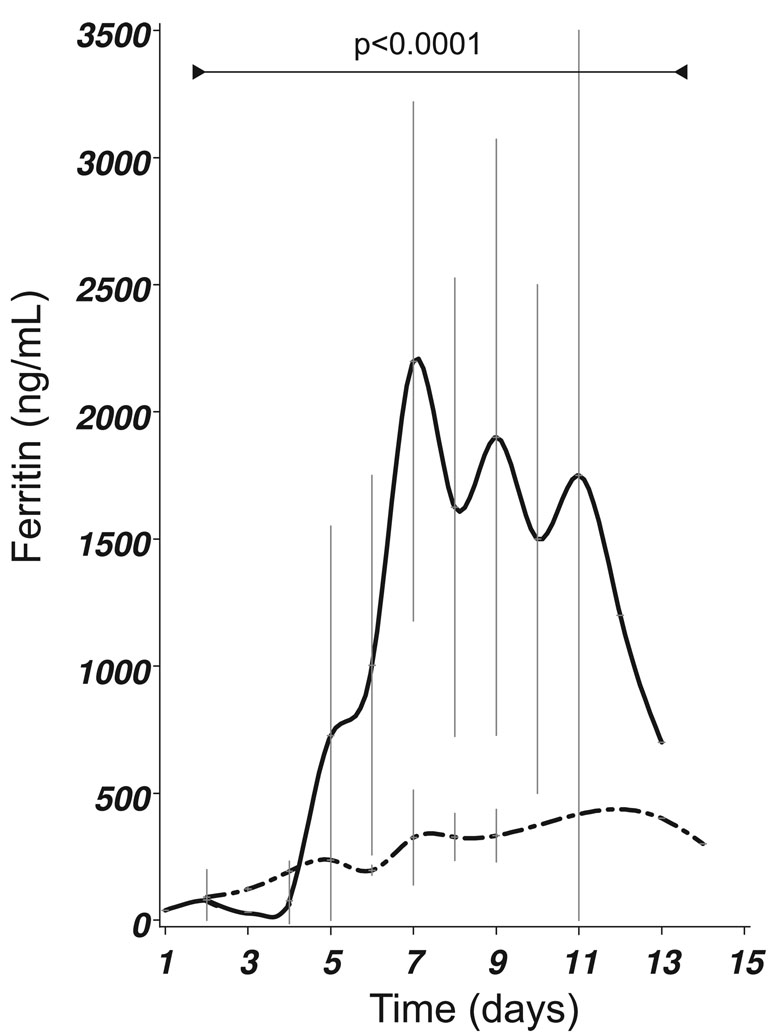
Figure 1: (B) Presence of IVH (closed line) was related to significantly higher CSF ferritin levels (F22,46 =3.63, p<0.0001) compared to any other form of blood distribution following SAH (dashed–dotted line). All patients shown in this graph underwent coiling of their aneurysm. The mean±SEM is shown.
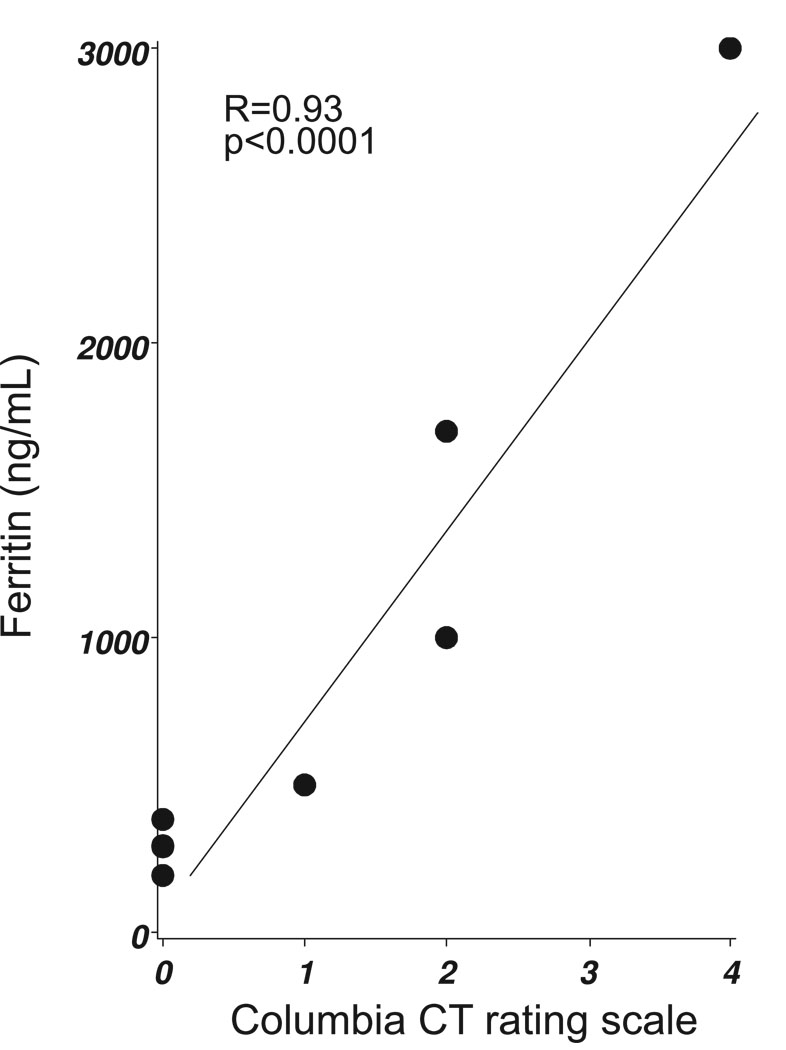
Figure 1: (C) The Columbia CT rating scale score correlated with CSF ferritin levels on day 9 (Spearman’s R=0.93, p<0.0001).


