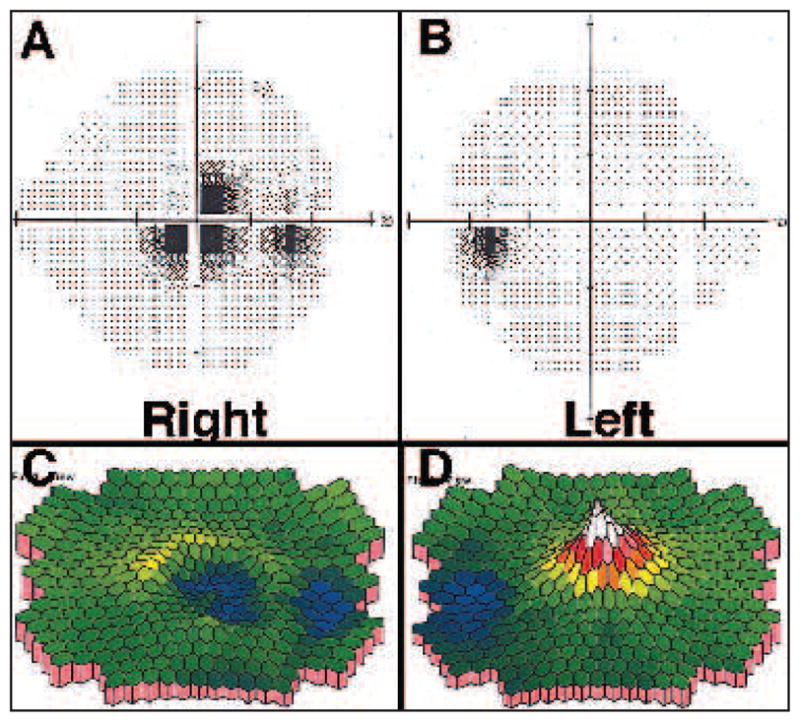
Figure 2.

(A and B) HVF of both eyes (OU). Grayscale results of Humphrey static perimetry: 24–2 threshold test was performed with stimulus size III and SITA-Standard algorithm. Right (A) shows central scotoma, whereas the left visual field is unaffected. (C and D) Multifocal electroretinogram analysis using a 103-hexagon stimulus display shown as pseudocolor response density plots (first-order kernel response) of patient shows central macular depression in the right eye (OD) (C) whereas the left eye (OS) is within normal limits (D).
