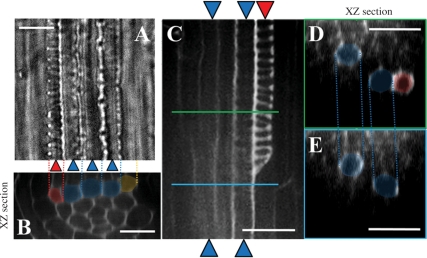
Fig. 2.
Confocal sections of the root vasculature. Confocal images of the protoxylem vessels and metaxylem vessels were taken from the mPS–PI-stained primary root of seedlings treated with 1 μM CLE10. (A) A bright field image. (B) A radial optical section of (A), which was constructed from Z-stack images by using image J (http://rsbweb.nih.gov/ij/). (C) A longitudinal image of a partially disrupted protoxlem vessel. (D, E) Radial optical sections of (C) at the green line position (D) and at the blue line position (E). Red and blue indicate protoxylem and metaxylem vessels, respectively. Orange indicates a cell where differentiation into protoxylem vessels has been inhibited. Scale bars are 25 μm.

