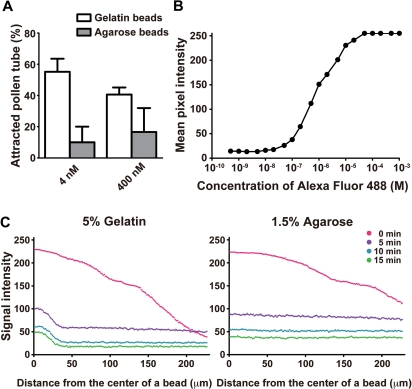
Fig. 5.
Spatiotemporal change of distribution of Alexa-LURE2 in different conditions using gelatin and agarose beads. (A) Alexa–LURE2 peptides in gelatin beads (open box) and agarose beads (filled box) were used for the in vitro attraction assays. Data are the means and SD (n = 3 with >8 pollen tubes per replicate). (B) The fluorescence intensities of Alexa Fluor 488 hydrazide were measured in a hemocytometer for different concentrations of Alexa Fluor 488 hydrazide. The mean fluorescence intensity per pixel was plotted against the concentration of Alexa Fluor 488 hydrazide. (C) The fluorescence intensities of Alexa–LURE2 in a 5% gelatin bead (left graph) and a 1.5% agarose bead (right graph) were measured at different time points. A 40 nM concentration of Alexa–LURE2 was used. The fluorescence intensity of the lines from the center of a bead was plotted.

