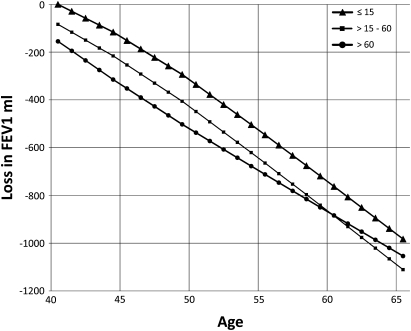
Figure 2.
Longitudinal change in FEV1 (ml) among 933 currently exposed males by cumulative fibre exposure (f-mo/cc). The combined effects on FEV1 from our longitudinal and cross-sectional models are shown beginning at age 40 for the largest cohort of 933 currently employed males. For example, at age 40, the intercept identifies a −83.7 ml loss in FEV1 for workers in the 15–60 f mo/cc exposure category. This information is derived from the cross-sectional data from table 2. The longitudinal data demonstrate subsequent yearly losses such as −33 ml at age 40, −43 ml at age 50, and −45 ml at age 60 (data from figure 1). Since the slope of the line representing the highest exposure category does not decline at a rate faster than the lower exposure category, no persistent exposure-related accelerated decline either as related to historical exposure or on-going exposure from 1987 to 2004 is observed.

