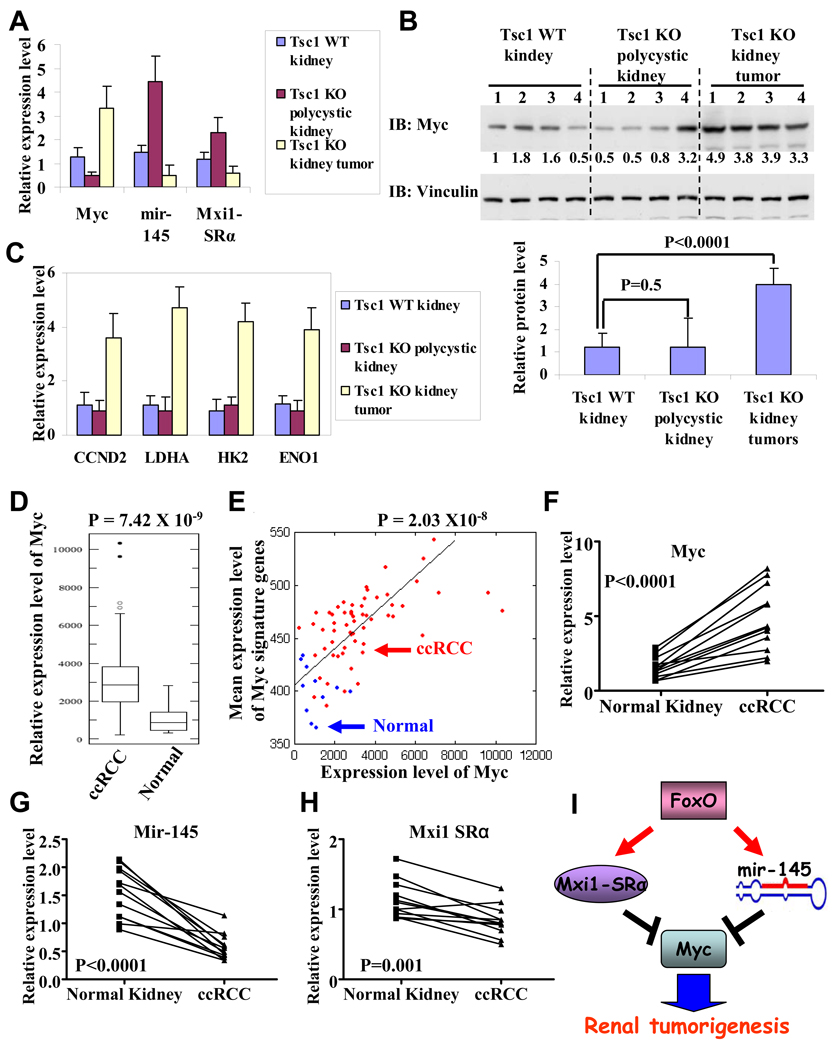
Figure 7. Myc/Mxi1-SRα/mir-145 alterations in Tsc1 renal cancer mouse models and human RCCs.
(A) Bar graphs showing relative expression levels of Myc, Mxi1-SRα, mir-145 in Tsc1 WT kidneys, Tsc1 KO polycystic kidneys and Tsc1 KO kidney tumors. 4 samples were analyzed in each setting. P < 0.01 for comparison between Tsc1 WT kidneys and Tsc1 KO polycystic kidneys (or Tsc1 KO kidney tumors) for each gene. (B) Western blotting showing Myc and Vinculin protein levels in Tsc1 WT kidneys, Tsc1 KO polycystic kidneys and Tsc1 KO kidney tumors. Quantified Myc protein levels are also shown in the bar graph. (C) Bar graphs showing relative expression levels of Myc targets in Tsc1 WT kidneys, Tsc1 KO polycystic kidneys and Tsc1 KO kidney tumors. 4 samples were analyzed in each setting. P > 0.05 for comparison between Tsc1 WT kidneys and Tsc1 KO polycystic kidneys for each gene. P < 0.01 for comparison between Tsc1 WT kidneys (or Tsc1 KO polycystic kidneys) and Tsc1 KO kidney tumors. (D) Box-plots showing Myc expression levels in ccRCC and normal kidney samples. (E) Positive correlation between expression levels of Myc and Myc signature genes in ccRCC and normal kidney samples. X axis: expression levels of Myc; Y axis: mean expression levels of Myc signature genes. Blue spots: normal kidney sample; Red spots: ccRCC sample. (F–H) The relative expression levels of Myc, Mxi1-SRa, mir-145 in 12 ccRCC samples and matched normal kidney samples. (I) FoxO inhibits Myc activity via transcriptional upregulation of Mxi1-SRα and downregulates Myc mRNA level via transcriptional upregulation of mir-145. Myc signaling is the key downstream effector of FoxO to suppress renal tumorigenesis. See also Figure S6.

