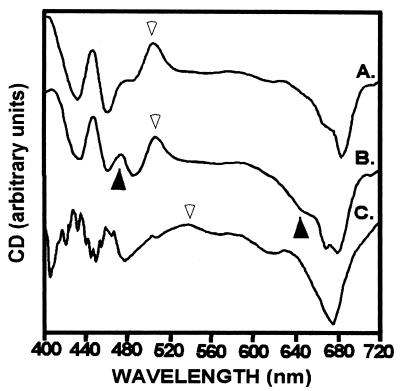
Figure 5.
CD spectra of LHCaR1 reconstituted with spinach pigments Chl a/b 2.8 (A), Chl a/b 0.7 (B), and diatom pigments (C). The increased signals at ca. 470 and 650 nm (▴) correlate with higher Chl b content (B). Signals at ca. 505 nm (A and B) and ca. 540 nm (C) are reflective of the carotenoid region (▵). (Measurements at room temperature were made at Chl concentrations of 30–40 μg/ml (1 cm pathlength). An average of four scans (100 nm/min) were corrected for buffer.

