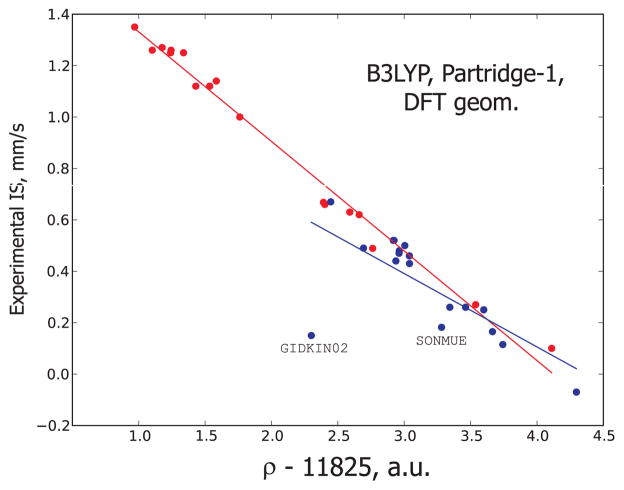
Figure 3.
The linear correlations observed between electronic density on iron and experimental isomer shift computed with the B3LYP functional and Partridge-1 basis set for the DFT-based geometries. The data in red correspond to the oxidation state +2, and the data in blue correspond to the oxidation states +3 and +4.

