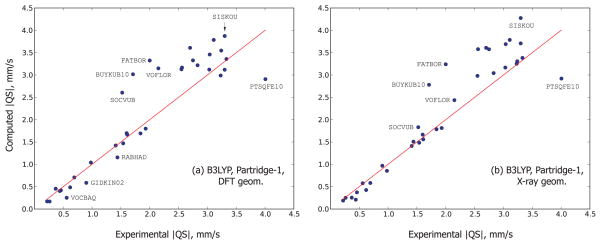
Figure 4.
The comparison of the quadrupole splittings computed with the B3LYP functional and Partridge-1 basis set using the DFT (a) and X-ray (b) geometries. The red line is y = x: the points lying it represent the perfect agreement between the experiment and the theory. The obvious outliers are indicated by their Cambridge Structural Database code which can also be found in Table I.

