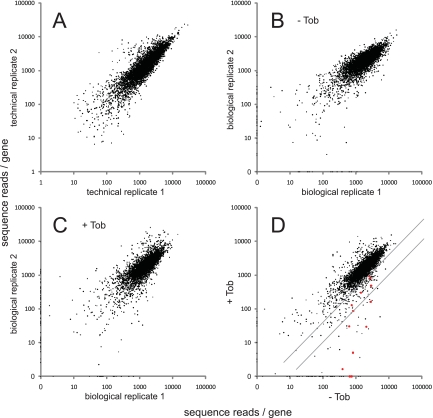
FIG 2 .
Identification of insertion mutants using Tn-seq. Pairs of Tn-seq assay results are compared, with the total number of reads per gene plotted. (A) Replicate Tn-seq analysis of a single DNA sample isolated from the 100,000-member transposon mutant pool. The total numbers of reads for genes were highly correlated (Pearson correlation coefficient = 87%). (B) Replicate analysis of DNA samples corresponding to two cultures of the 100,000-member mutant pool grown in the absence of tobramycin (Tob) (correlation coefficient = 80%). (C) Replicate analysis of DNA samples corresponding to two cultures of the mutant pool grown in the presence of a subinhibitory tobramycin concentration (0.36 µg/ml) (correlation coefficient = 71%). (D) Comparison of the growth of the mutant pool without tobramycin to its growth with tobramycin. Values represent average numbers of reads per gene from the pairs of biological replicates (panels B and C). Red points represent genes for which mutants were previously identified as being strongly tobramycin hypersensitive (7). The diagonal lines represent the thresholds for 2.5-fold and 10-fold negative selection, respectively. Points on the axes in panels B and C reflect genes represented in only one of the two biological replicates. In almost all cases, these represent genes with very few (fewer than three) total insertions. Most (79%) of these genes were excluded from the analysis of negative selection because of the low representation (see Materials and Methods). Read counts per gene were calculated and normalized as described in Materials and Methods, except for panel A, in which insertions at all positions within each gene were included and values were not normalized for gene length.

