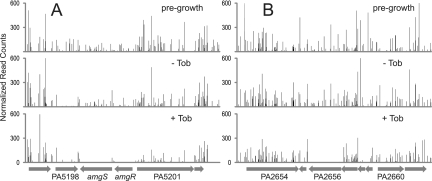
FIG 3 .
Examples of negative selection revealed by Tn-seq. The graphs show the number of Tn-seq reads at each location from the sample prior to growth, after growth without tobramycin (Tob), and after growth with a subinhibitory concentration of tobramycin. Data are averaged from biological replicates and normalized as described in Materials and Methods. Regions of the genome corresponding to 8,000 bp are shown, with the predicted genes represented at the bottom of each panel. (A) The amgRS region. Insertions in both amgR and amgS are selected against strongly in the presence of tobramycin, whereas insertions in PA5198 are selected against whether or not tobramycin is present. (B) The PA2656 region. The graphs show strong negative selection of PA2656 mutants in the presence of tobramycin. PA2656 encodes a two-component regulator implicated in intrinsic tobramycin resistance by these results.

