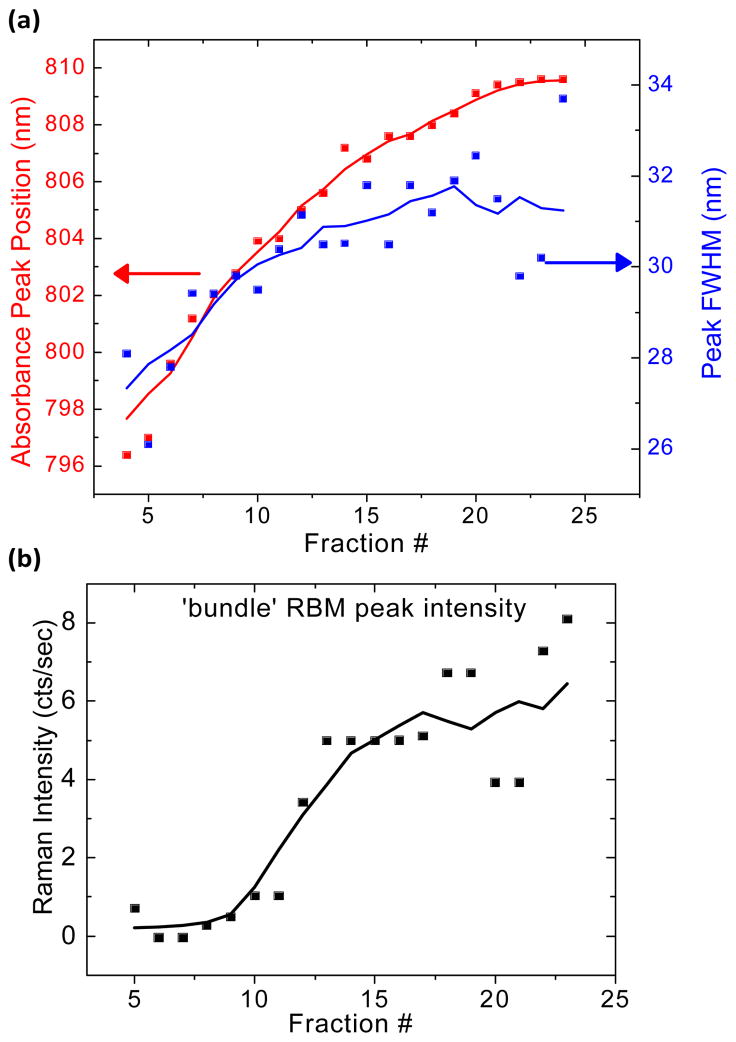
Figure 4.
Spectral properties of the SWNT optical transition near 800 nm. (a) Absorption peak position and full-width at half-maximum tend to increase with increasing fraction number. The arrows indicate the absorption peak position and FWHM, respectively, of the cholate-SWNT starting material, before DGC separation. (b) Peak intensity for the SWNT RBM feature at 266 cm−1, referred to as the “bundle peak,” following 785 nm excitation, with increasing fraction number. The solid lines represent moving averages (n=3) to aid in the observation of trends.

