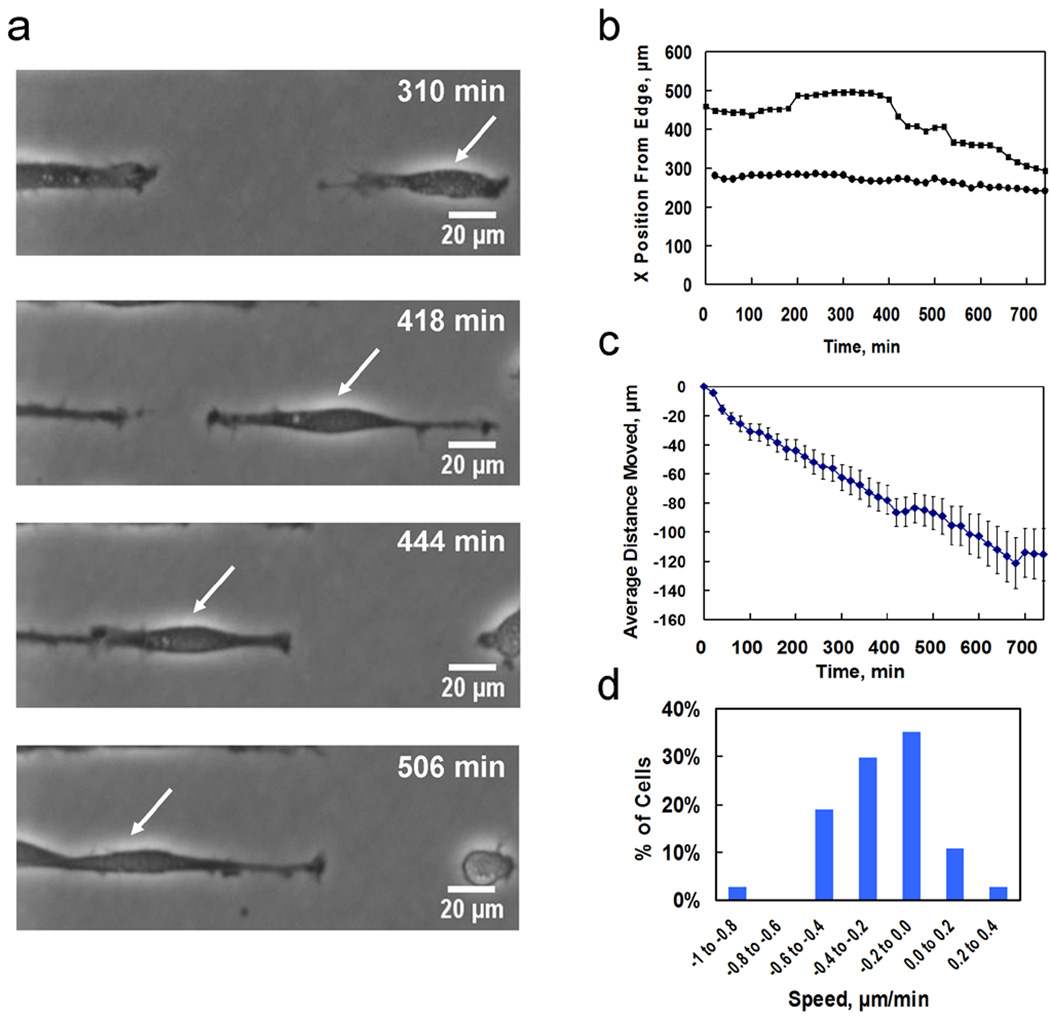
Figure 3. Cell-to-cell interactions.
(a) Image sequence showing a 3T3 fibroblast migrating leftward and contacting a neighboring cell then continuing to migrate leftward at an increased speed. (b) Migration data for selected cells shown in video V1, tracked over 12 hours. Black squares depict the cell in (a) which changes migration behavior (change in slope) upon contact with a neighboring cell. Black circles show migration behavior of a cell which does not change migration behavior upon contact with a neighboring cell. (c) Average distance moved for all cells over the observation period, showing the leftward bias, error bars are SEM. (d) Average speed distribution of cells during 740 minutes. (e) Number of cells displaying types of migration behavioral changes.

