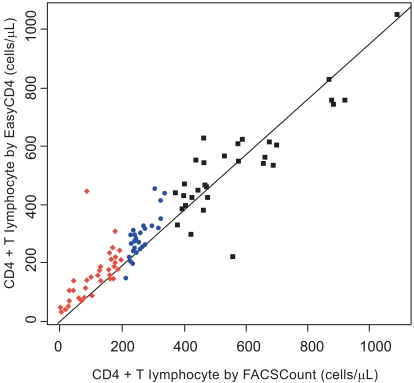
Fig. (1).
Correlation Analysis of the EasyCD4 assay and FACSCount for cell counts (cells/µL), divided into CD4+ T lymphocyte count by FACSCount <200 cells/µL (red diamonds), 200-350 cells/µL (blue circles), and > 350 cells/µL (black squares). Spearman rank correlation coefficient = 0.92 (P<0.001). The solid line represents the regression line. Mean CD4 counts for the EasyCD4 and FACSCount systems were 313.75 cells/µL and 303.47 cells/µL, respectively.

