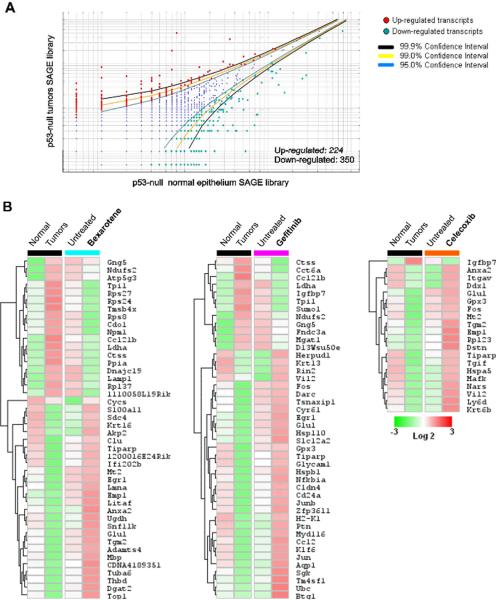
FIGURE 3.
Transcripts identified as deregulated in p53-null mammary tumors that were observed to be modulated in the opposite direction as the result of treatment with chemopreventive agents in normal mammary epithelium (i.e. up in tumors, down in the treated epithelium or viceversa). (A) Scatter-plot representation of differentially expressed genes between p53-null `normal' epithelium and p53-null tumors SAGE libraries (p< 0.05). (B) Heat maps of the transcripts modulated in the opposite direction in tumors vs treated normal epithelium: p53-null tumors (Black cluster) and bexarotene treated normal p53 null mice epithelium (aquamarine cluster), gefitinib treated (fuchsia cluster) and celecoxib treated (orange cluster). Color scale at the bottom depicts the approximate fold change in expression for each transcript and library relative to control mammary gland. Negative fold change is represented in green, and positive fold change is represented in red.

