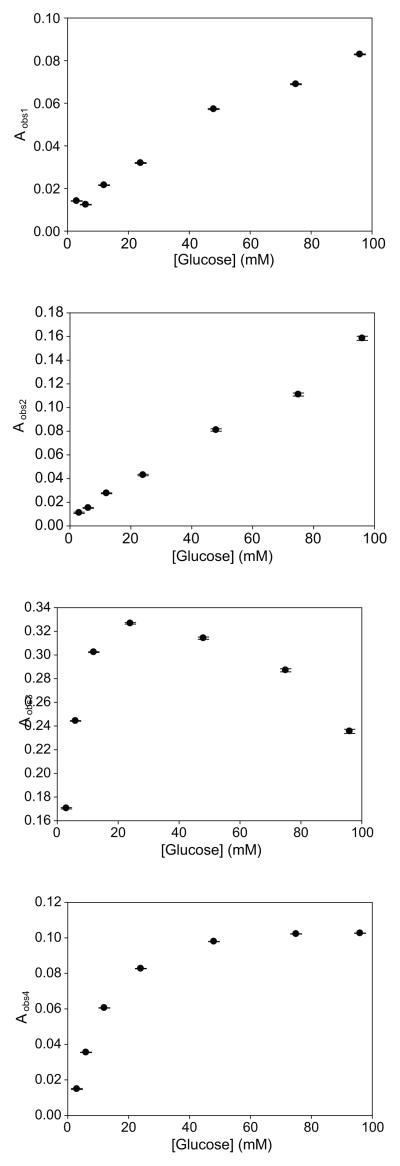
Figure 5.
The amplitudes of the four observed transient signals as a function of glucose concentration. The amplitudes were obtained by fitting the data to an analytical solution comprised of four exponential terms. Error bars represent the goodness of fit between the experimental data and the analytical solution.

