Figure 3.
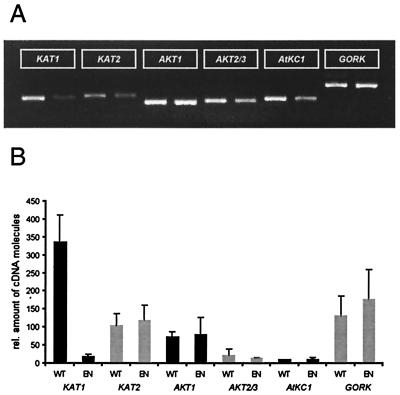
Quantitative RT-PCR. (A) Gel electrophoresis of RT-PCR products of either wild-type (left lanes) or KAT1∷En-1 (right lanes) guard cell protoplast mRNA (positive signals only); representative of n = 3 experiments. Fragments were cloned and sequenced for verification. Notice that KAT1 transcripts are also detectable in the KAT1∷En-1. Fragment length are for KAT1 = 379 bp, KAT2 = 392 bp, AKT1 = 347 bp, AKT2/3 = 353 bp, AtKC1 = 373 bp, and AtGORK = 496 bp. (B) Quantification of K+ channel transcripts by external standards relative to actin in different guard cell protoplast preparations of wild-type (WT) and KAT1∷En-1 (EN; n = 3 ± SD). The figure shows the calculated amount of cDNA molecules in the individual probes. KAT1 expression in the KAT1∷En-1 compared with the wild type is about 6%.

