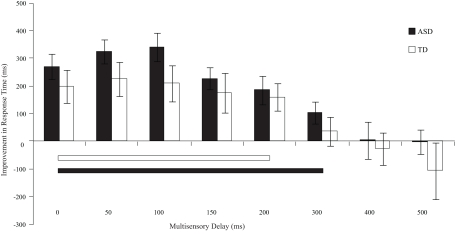
Figure 5.
Improvement in response times relative to visual-only performance as a function of multisensory delay. Whereas typically developing children show improvements for short delays (i.e., 0–200 ms), children with ASD show improvements for both moderate and short delays (i.e., 0–300 ms). The solid line indicates continuous significant (p < 0.05) differences from zero. Error bars represent standard error of the mean (SEM).

