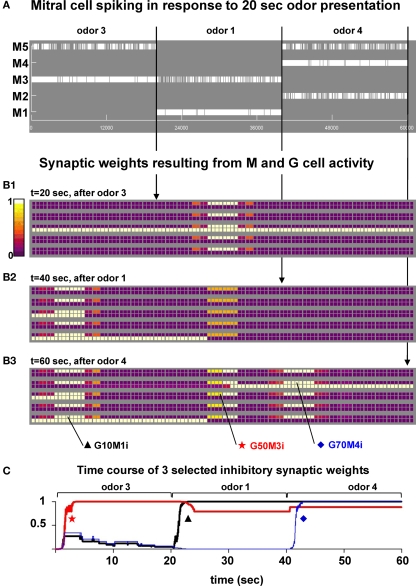
Figure 3.
Presentation of a sequence of different odors generates clusters of mitral–granule cells synapses. (A) Mitral cell raster plot during a 60-s simulation in which odors 3, 1, and 4 were presented in sequence (20 s each). (B1–B3) Snapshots of the synaptic weights at different times during the simulation. (C) Time course of the normalized inhibitory weight for three synapses (G10M1i, G50M3i, and G70M4i). The location of the synapses in the network is indicated in (B3). A movie of this simulation is available as Supplementary Movie S1.

