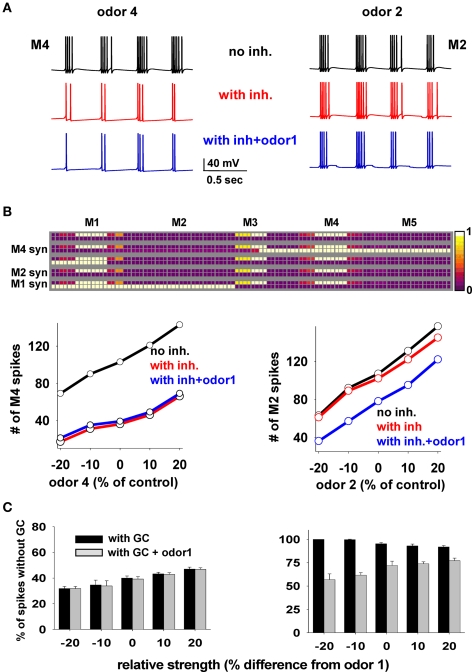
Figure 6.
Mitral cell output in response to a mixture depends on whether the components have been learned. (A) Somatic membrane potential of M4 (left) or M2 (right) during a 2-s window in three cases (black, no granule cells; red, with granule cells and no odor 1; blue, with granule cells and odor 1). (B) Top: Synaptic weights after the training protocol used for Figure 3; bottom: number of M4 (left) or M2 (right) somatic spikes during presentation of different odor combinations as a function of odors 4 or 2 strength, respectively; in all cases control strength is the input used in the simulation for Figure 3; red lines are slightly shifted downward for full visibility. (C) Average number of spikes (±SD) from five simulations, for M4 (left) and M2 (right) with respect to control, as a function of relative odor strength under different conditions.

