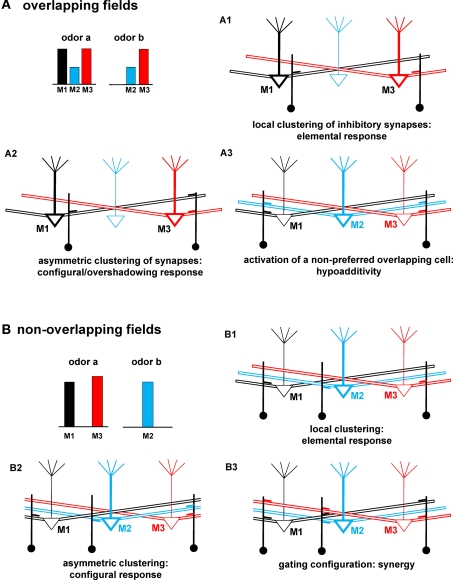
Figure 9.
Schematic correlation between network connectivity and odor qualities. (A) Schematic representation of mitral–granule connectivity after a training period with an odor mixture (odor a and odor b) activating overlapping mitral cells (M2 and M3), and resulting in: (A1) no interaction between M1 and M3, (A2) an asymmetric interaction between M1 and M3, note the lack of local synapses close to the soma of M1, (A3) synapses activated by a non-preferred cell (M2, blue). (B) Schematic of mitral–granule connectivity after training with an odor mixture (odor a and odor b) activating non-overlapping mitral cells, and resulting in: (B1) no interaction between mitral cells, (B2) an asymmetric interaction of M2 with M1, note the lack of M2 (blue) synapses close to the soma of M1, (B3) a gating configuration of the cluster close to M2. For clarity, mitral cells not primarily involved in a specific effect for each case are drawn with lighter lines.

