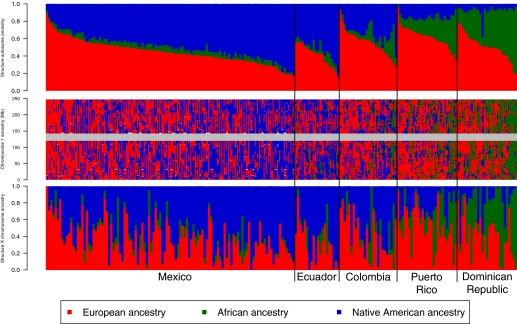
Fig. 3.
Genome-wide and locus specific ancestry estimates for Mexicans, Ecuadorians, Colombians, Puerto Ricans, and Dominicans. Shown for K = 3, clustering of the Hispanic/Latino individuals on the autosomes (Top) and on the X chromosome (Bottom). Individuals are shown as vertical bars colored in proportion to their estimated ancestry within each cluster. Local ancestry at each locus is shown for each individual on chromosome 1 (Middle). The X chromosome shows greater Native American ancestry (blue) and greater variability in African ancestry (green), with reduced European ancestry (red).

