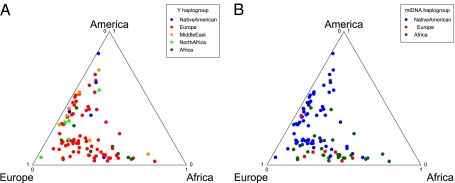
Fig. 6.
Comparison of mtDNA and Y chromosome haplotypes. Each individual is represented by a point within the triangle that represents the autosomal ancestry proportions. The most probable continental location for each individual’s haplotype is designated by the color of the point. The Y chromosome contains a disproportionate number of European haplotypes, whereas the mtDNA has a high proportion of Native American, slightly more African haplotypes and fewer European haplotypes, consistent with a sex bias toward a great European male and Native American/African female ancestry in the Hispanic/Latinos.

