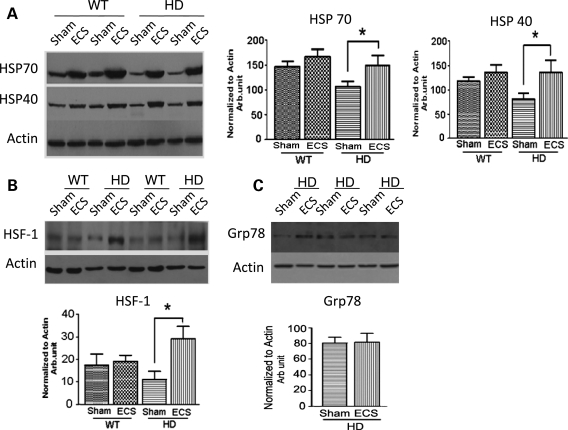
Figure 4.
ECS elevates levels of adaptive stress response proteins in the striatum of HD mice. (A) A representative immunoblot (left) and results of densitometric analysis (right) of Hsp70 and Hsp40 protein levels in striatal tissue samples from ECS- and sham-treated HD and WT mice. *P< 0.05. (B and C) An immunoblot (upper) and results of densitometric analysis (lower) of HSF-1 (B) and Grp78 (C) protein levels in striatal tissue samples from the indicated groups of mice. Values are the mean and SEM (n = 8–10 mice per group). *P< 0.05.

