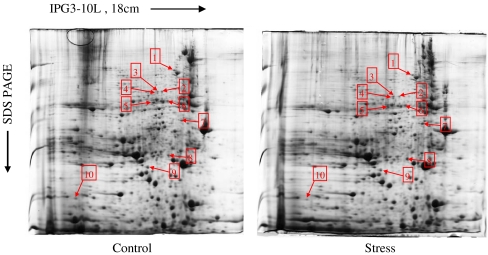
Fig. 3.
Representative 2D map of rat heart from control and stress groups. Proteins (1.5 mg) were loaded on pH 3–10 linear IPG strips (18 cm), with 10%T vertical SDS-PAGE as the second dimension. The gel was visualized by CBB R-250 staining. Spots differentially expressed with p < 0.05 calculated with Student's t test, are indicated

