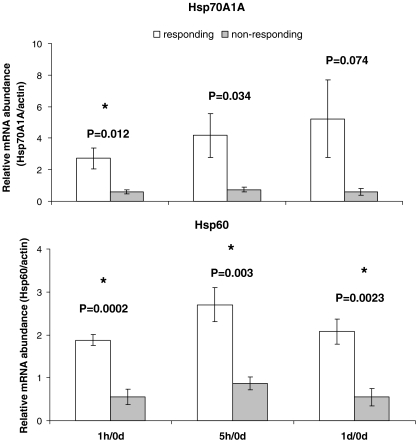
Fig. 2.
Variations in the relative mRNA abundance of Hsp70A1Aand Hsp60 (relative to pretransportation; 0d) in leukocytes of relocated Holstein–Friesian calves. Data are presented as means ± SEM. P values above bars indicate significant differences between individuals with elevated (responding) and non-elevated (nonresponding) Hsp levels. Asterisks denote significant differences after Bonferroni correction

