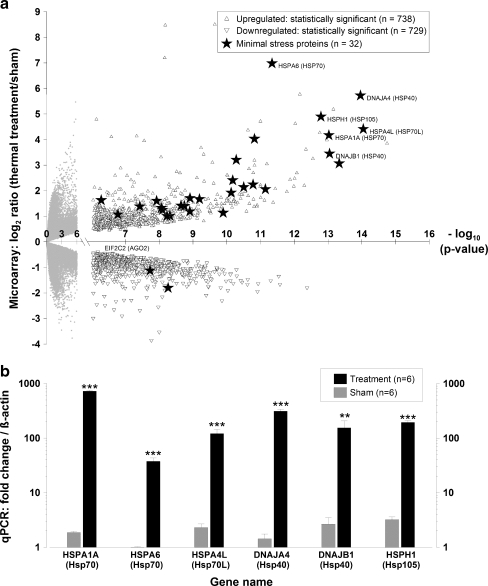
Fig. 1.
Hyperthermia stress protocol induces an appreciable cellular stress response as evidenced by the marked up-regulation of minimal stress proteins. Dermal fibroblasts were exposed to a hyperthermia protocol (44°C for 40 min), and RNA was extracted 4 h post-exposure. Microarrays and qPCR analyses were conducted for control and treatment groups with n = 6 for each group. a Volcano plot of mRNA microarray data, where the magnitude of the expression is plotted versus the level of statistical significance. Statistical significant genes were identified using Bonferroni correction procedures with a cutoff of −log10p > 6.04. Statistically insignificant targets (empty circles), significant targets (triangles), significant minimal stress proteins (filled stars). Data are expressed as means. b Gene expression for minimal stress proteins (HSPA1A, HSPA6, HSPA4L, DNAJA4, DNAJB1, and HSPH1) using qRT-PCR. The mRNA expression fold values  were measured for sham and treatment groups with n = 6 for each group. Values were calculated in relation to β-actin and normalized to a separate RNA calibrator. Sham (gray bar), treatment (black bar). Data are expressed as means ± SD; ***p < 10−5, **p < 10−3; between indicated groups

