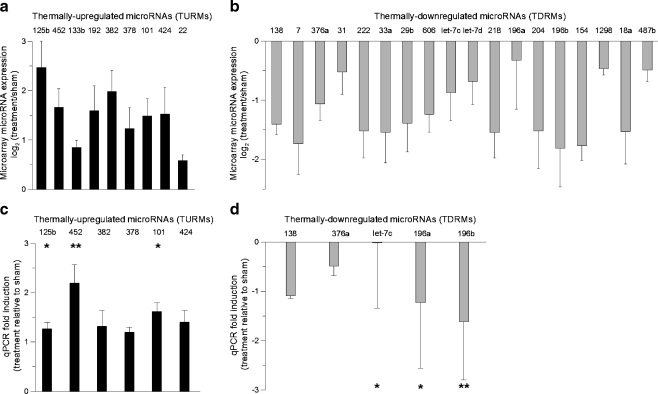
Fig. 3.
Quantification of microarray data and qPCR validation of annotated thermally regulated microRNAs (TRMs). a–b miRNA microarray expression data for thermally up-regulated and thermally down-regulated miRNAs (mean ± SD, n = 6). For both plots, the mean log2 fold change between the treatment and sham groups is plotted for each miRNA. c–d Taqman qRT-PCR validation of thermally regulated miRNA targets. Fold-changes (treatment relative to sham) were calculated using the  method. Values were calculated against designated calibrators and were normalized to RNU48—endogenous control. TURMs (black bar), TDRMs (gray bar). Data are expressed as means ± SD; *p < 0.05, **p < 0.01; between indicated groups

