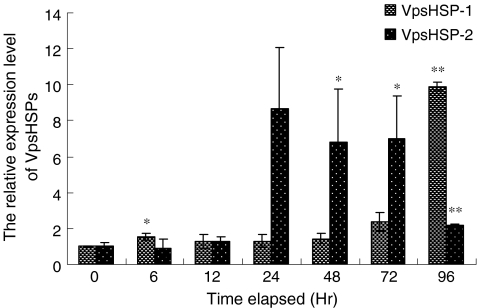
Fig. 4.
Time-course expression level of VpsHSP-1 and VpsHSP-2 transcript in haemocytes after V. anguillarum infection measured by quantitative real-time PCR at 0, 6, 12, 24, 48, 72, and 96 h. Each symbol and vertical bar represented the mean±SD (n = 5). Significant differences across control were indicated with an asterisk at P < 0.05 and two asterisks at P < 0.01

