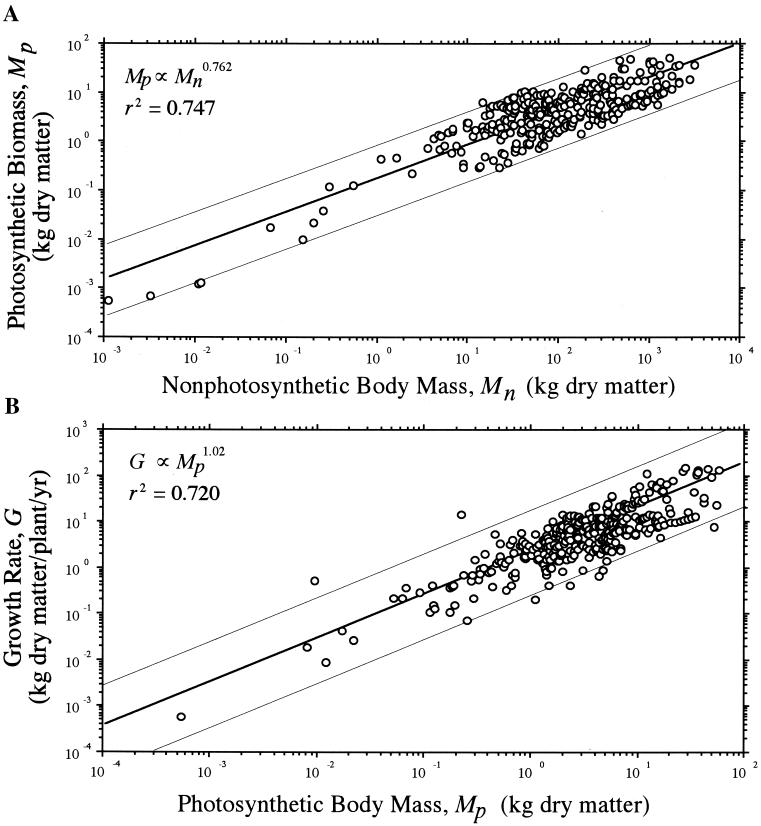
Figure 3.
Photosynthetic (foliage) biomass Mp plotted against nonphotosynthetic (stem and root) body mass Mn (A) and annualized biomass production (growth) rates G plotted against photosynthetic body mass Mp for metaphytes (data taken from ref. 32) (B). Solid lines are reduced major axis (Model Type II) regression curves (hair lines indicate their 95% confidence intervals); scaling exponents (upper left) based on log10-transformed data.

