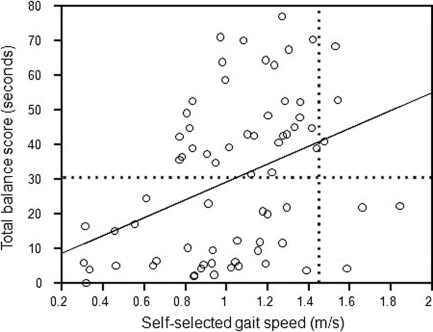
Figure 1.
Relationship between total balance scores and self-selected gait speed. The solid line represents the line of best fit; the horizontal dotted line represents the mean total balance score for TBI; the vertical dotted line represents the normal self-selected walking speed for young adults.21

