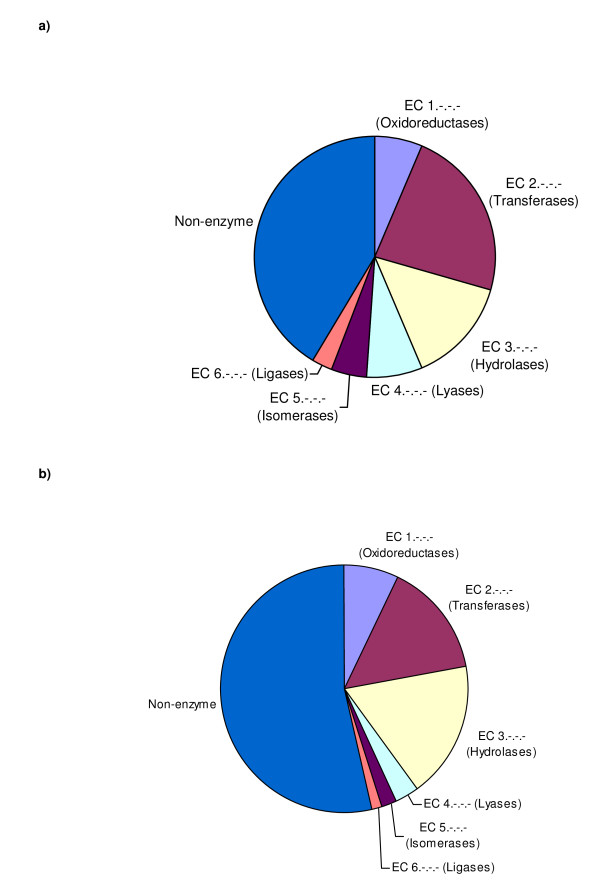
Figure 2.
EC classes of MCSG structures compared to the PDB as a whole. a) Pie chart showing the distribution of EC classes for the MCSG structures that have a known function. b) Pie chart showing the distribution of EC classes for all PDB entries taken from the Enzyme Structures Database at the EBI http://www.ebi.ac.uk/thornton-srv/databases/enzymes/.

