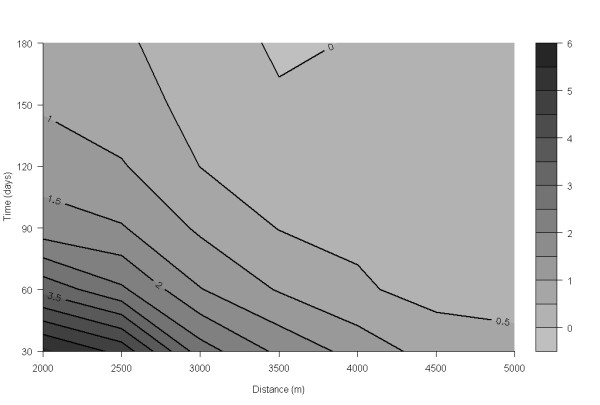
Figure 10.

Spatio-temporal K-function of PCVAD spread under Ontario conditions. Areas in the lower left corner, representing neighborhoods close in space and time to an outbreak farm, pose higher risk for farms in that area. This is indicated by darker shades of gray and lines above the proportional increase in risk of 1.
